
Extracting Economic Data from Brazil's Central Bank PDF
This PDF is the weekly “Focus” report from Brazil’s central bank with economic projections and statistics. Challenges include commas instead of decimal points, images showing projection changes, and tables without border lines that merge during extraction.
from natural_pdf import PDF

pdf = PDF("focus.pdf")
page = pdf.pages[0]
page.show()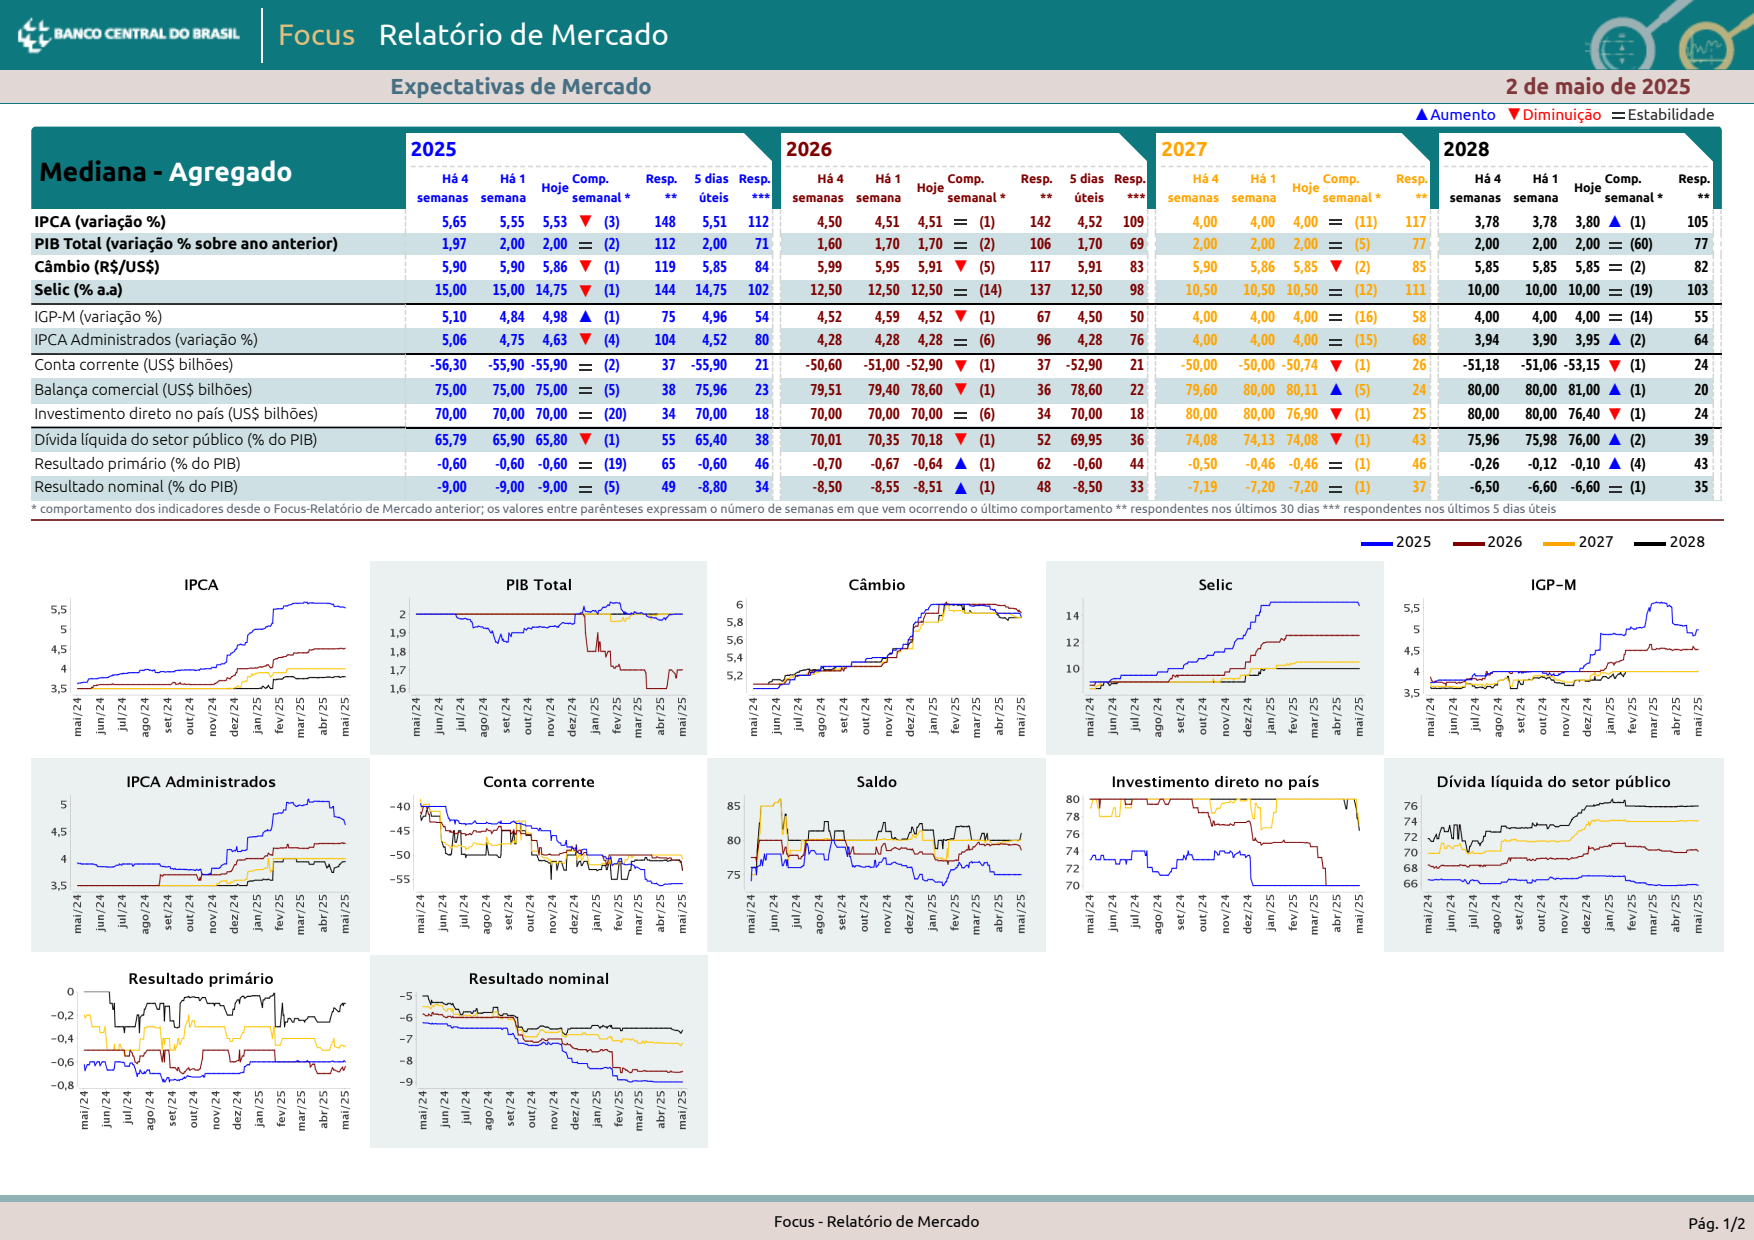
Let's cut out the part of the page we're interested in: everything from Expectativas to the long, light text that starts with comportamento.
data = (
    page
    .find(text='Expectativas')
    .below(
        until='text:contains(comportamento)',
        include_endpoint=False
    )
)

data.show(crop=True)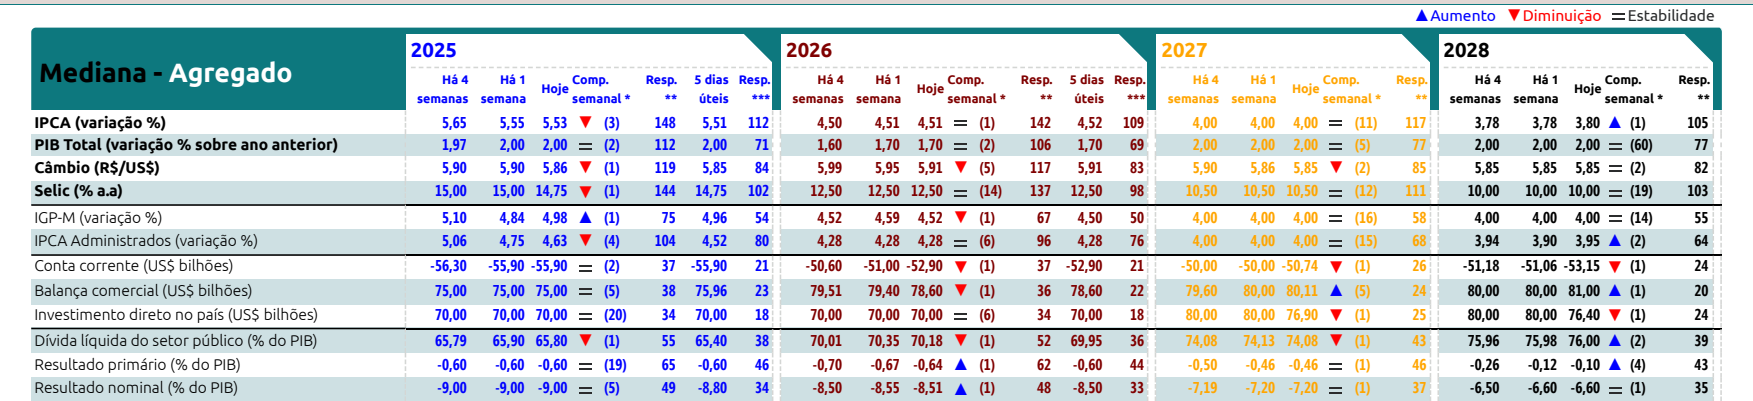
Grabbing headers
While we could type out the column names on the left, it's probably easier to just scrape them from the page. We start from IPCA, move down, clip it to the section we cut out earlier (otherwise it runs down the whole page), then find all of the text that even somewhat overlaps.
row_names = (
    data
    .find(text='IPCA')
    .below(width='element', include_source=True)
    .clip(data)
    .find_all('text', overlap='partial')
)
headers = row_names.extract_each_text()
headers
['IPCA (variação %)', 'PIB Total (variação % sobre ano anterior)', 'Câmbio (R$/US$)', 'Selic (% a.a)', 'IGP-M (variação %)', 'IPCA Administrados (variação %)', 'Conta corrente (US$ bilhões)', 'Balança comercial (US$ bilhões)', 'Investimento direto no país (US$ bilhões)', 'Dívida líquida do setor público (% do PIB)', 'Resultado primário (% do PIB)', 'Resultado nominal (% do PIB)']
Horizontal sections
While you usually use .get_sections to split pages vertically, you can also do it horizontally. In this case we'll find the year headers - four numbers in a row, size 10 font - and use them as our breakpoints.
sections = (
    data.get_sections(
        start_elements="text[size~=10]:regex(\d\d\d\d)",
        include_boundaries='start',
        orientation='horizontal'
    )
)
sections.show()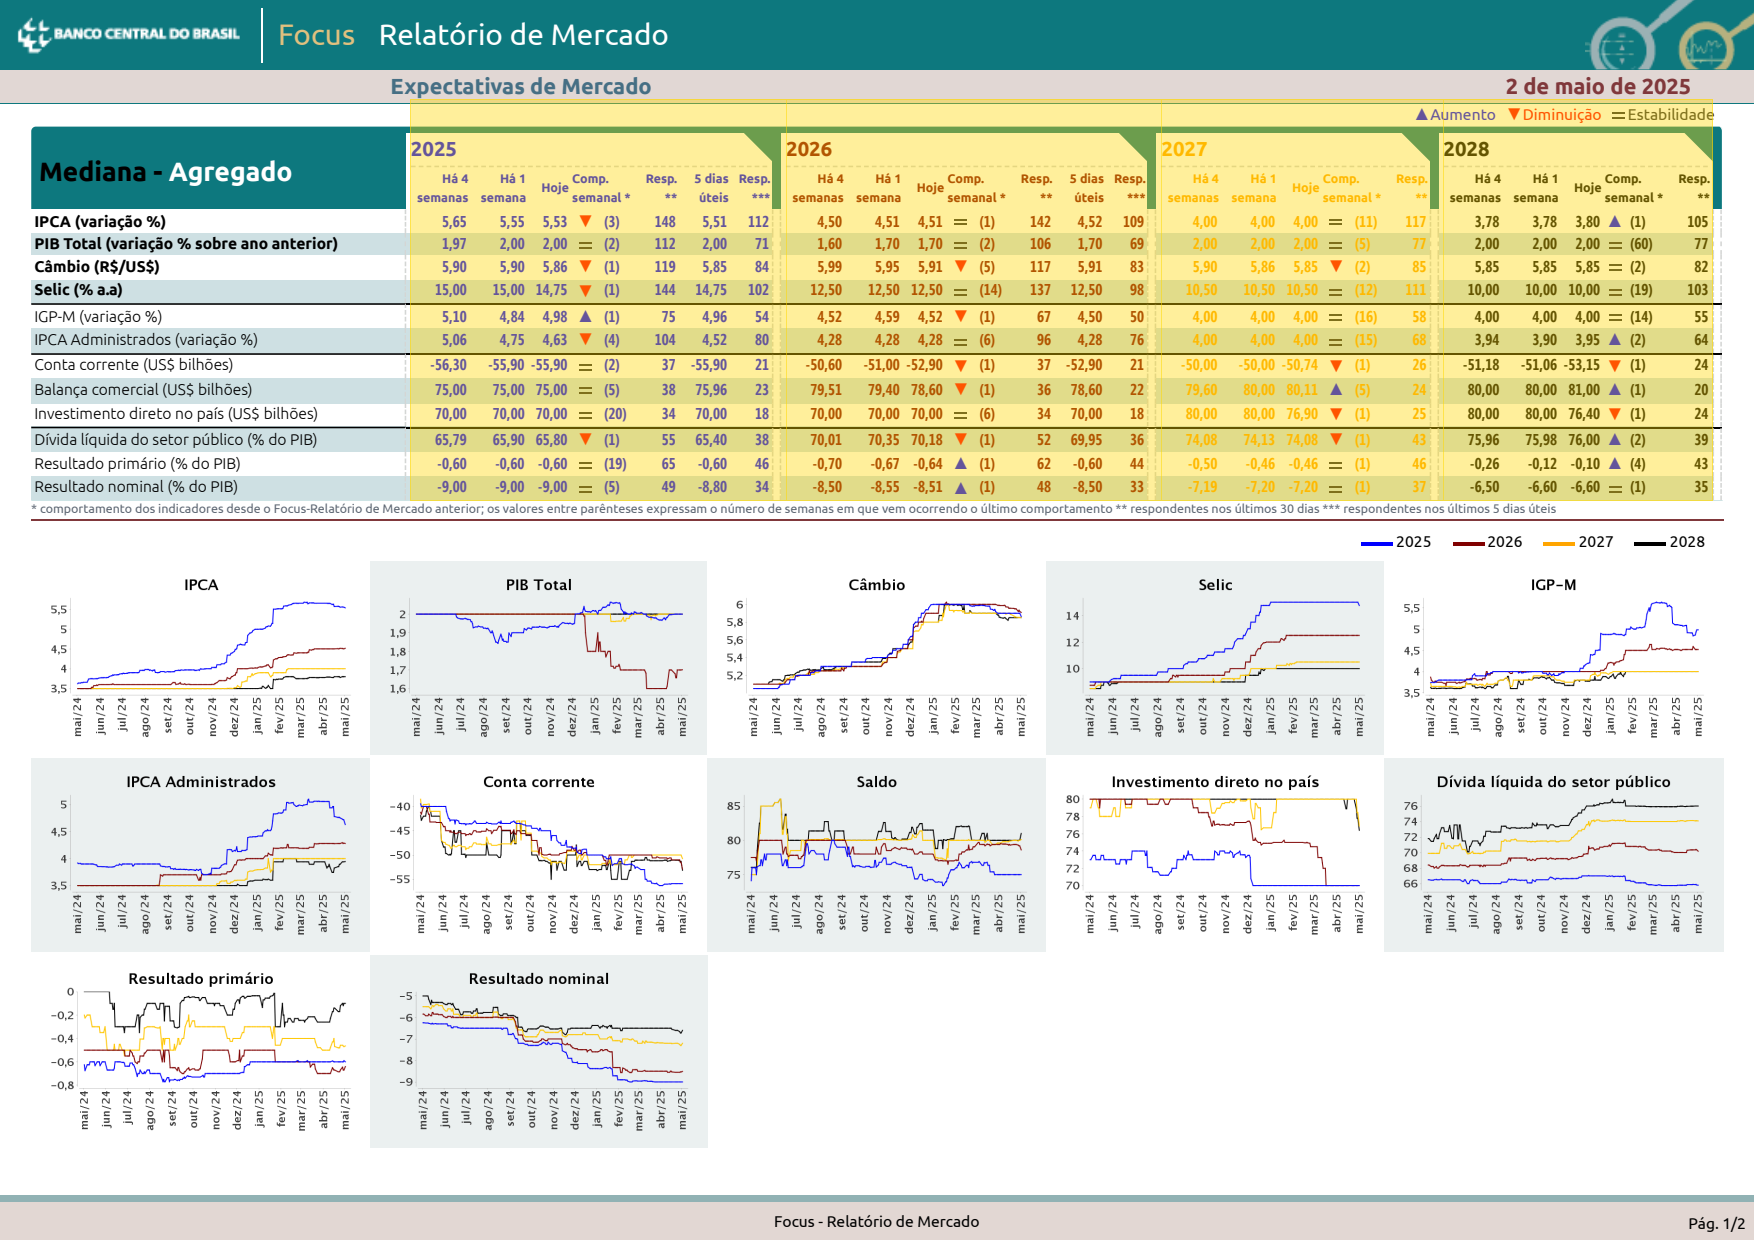
We'll take the first table as an example. We don't want all of that junk up top – it's easy to retype multi-row headers – so we'll dial it back in a bit.
(
    sections[0]
    .expand(top=-50)
    .show()
)
Then we'll ask it to extract the content using the stream method, which uses the space between text. Even though we can see lines and backgrounds and all sorts of things, stream works consistently when other approaches don't!
(
    sections[0]
    .expand(top=-50, right=0)
    .extract_table('stream')
    .to_df(header=False)
    .dropna(axis=0, how='all')
)| 0 | 1 | 2 | 3 | 4 | 5 | 6 | 7 | |
|---|---|---|---|---|---|---|---|---|
| 0 | semanas | semana | s | ema | nal * | ** | úteis | *** |
| 1 | 5,65 | 5,55 | 5,53 | ▼ | (3) | 148 | 5,51 | 112 |
| 2 | 1,97 | 2,00 | 2,00 | <NA> | (2) | 112 | 2,00 | 71 |
| 3 | 5,90 | 5,90 | 5,86 | ▼ | (1) | 119 | 5,85 | 84 |
| 4 | 15,00 | 15,00 | 14,75 | ▼ | (1) | 144 | 14,75 | 102 |
| 5 | 5,10 | 4,84 | 4,98 | ▲ | (1) | 75 | 4,96 | 54 |
| 6 | 5,06 | 4,75 | 4,63 | ▼ | (4) | 104 | 4,52 | 80 |
| 8 | -56,30 | -55,90 | -55,90 | <NA> | (2) | 37 | -55,90 | 21 |
| 10 | 75,00 | 75,00 | 75,00 | <NA> | (5) | 38 | 75,96 | 23 |
| 11 | 70,00 | 70,00 | 70,00 | <NA> | (20) | 34 | 70,00 | 18 |
| 13 | 65,79 | 65,90 | 65,80 | ▼ | (1) | 55 | 65,40 | 38 |
| 14 | -0,60 | -0,60 | -0,60 | <NA> | (19) | 65 | -0,60 | 46 |
| 15 | -9,00 | -9,00 | -9,00 | <NA> | (5) | 49 | -8,80 | 34 |
We include the .dropna in there because stream injects some phantom rows full of empty values.
Looping through sections
Now that we know how it works from one section, let's do it for all of them. We'll use .apply so that it creates a list of dataframes that we can combine later on.
dataframes = sections.apply(lambda section: (
    section
        .expand(top=-50, right=0)
        .extract_table('stream')
        .to_df(header=False)
        .dropna(axis=0, how='all')
        .assign(
            year=section.find('text[size~=10]:regex(\d\d\d\d)').extract_text(),
            value=headers
        )
    )
)

import pandas as pd

pd.concat(dataframes, ignore_index=True)Traceback (most recent call last):
File "/home/runner/work/badpdfs-site/badpdfs-site/processor/tasks/execution.py", line 361, in _execute_code
exec(code_without_last, self.namespace)
File "<string>", line 1, in <module>
File "/home/runner/work/badpdfs-site/badpdfs-site/processor/.venv/lib/python3.11/site-packages/natural_pdf/collections/mixins.py", line 100, in apply
results = [func(item, *args, **kwargs) for item in items_iterable]
^^^^^^^^^^^^^^^^^^^^^^^^^^^^^^^^^^^^^^^^^^^^^^^^^^^^^^^^
File "/home/runner/work/badpdfs-site/badpdfs-site/processor/.venv/lib/python3.11/site-packages/natural_pdf/collections/mixins.py", line 100, in <listcomp>
results = [func(item, *args, **kwargs) for item in items_iterable]
^^^^^^^^^^^^^^^^^^^^^^^^^^^
File "<string>", line 1, in <lambda>
File "/home/runner/work/badpdfs-site/badpdfs-site/processor/.venv/lib/python3.11/site-packages/pandas/core/frame.py", line 5246, in assign
data[k] = com.apply_if_callable(v, data)
~~~~^^^
File "/home/runner/work/badpdfs-site/badpdfs-site/processor/.venv/lib/python3.11/site-packages/pandas/core/frame.py", line 4316, in __setitem__
self._set_item(key, value)
File "/home/runner/work/badpdfs-site/badpdfs-site/processor/.venv/lib/python3.11/site-packages/pandas/core/frame.py", line 4529, in _set_item
value, refs = self._sanitize_column(value)
^^^^^^^^^^^^^^^^^^^^^^^^^^^^
File "/home/runner/work/badpdfs-site/badpdfs-site/processor/.venv/lib/python3.11/site-packages/pandas/core/frame.py", line 5273, in _sanitize_column
com.require_length_match(value, self.index)
File "/home/runner/work/badpdfs-site/badpdfs-site/processor/.venv/lib/python3.11/site-packages/pandas/core/common.py", line 573, in require_length_match
raise ValueError(
ValueError: Length of values (12) does not match length of index (13)
import pandas as pd
pd.concat(dataframes, ignore_index=True)
Grabbing tables
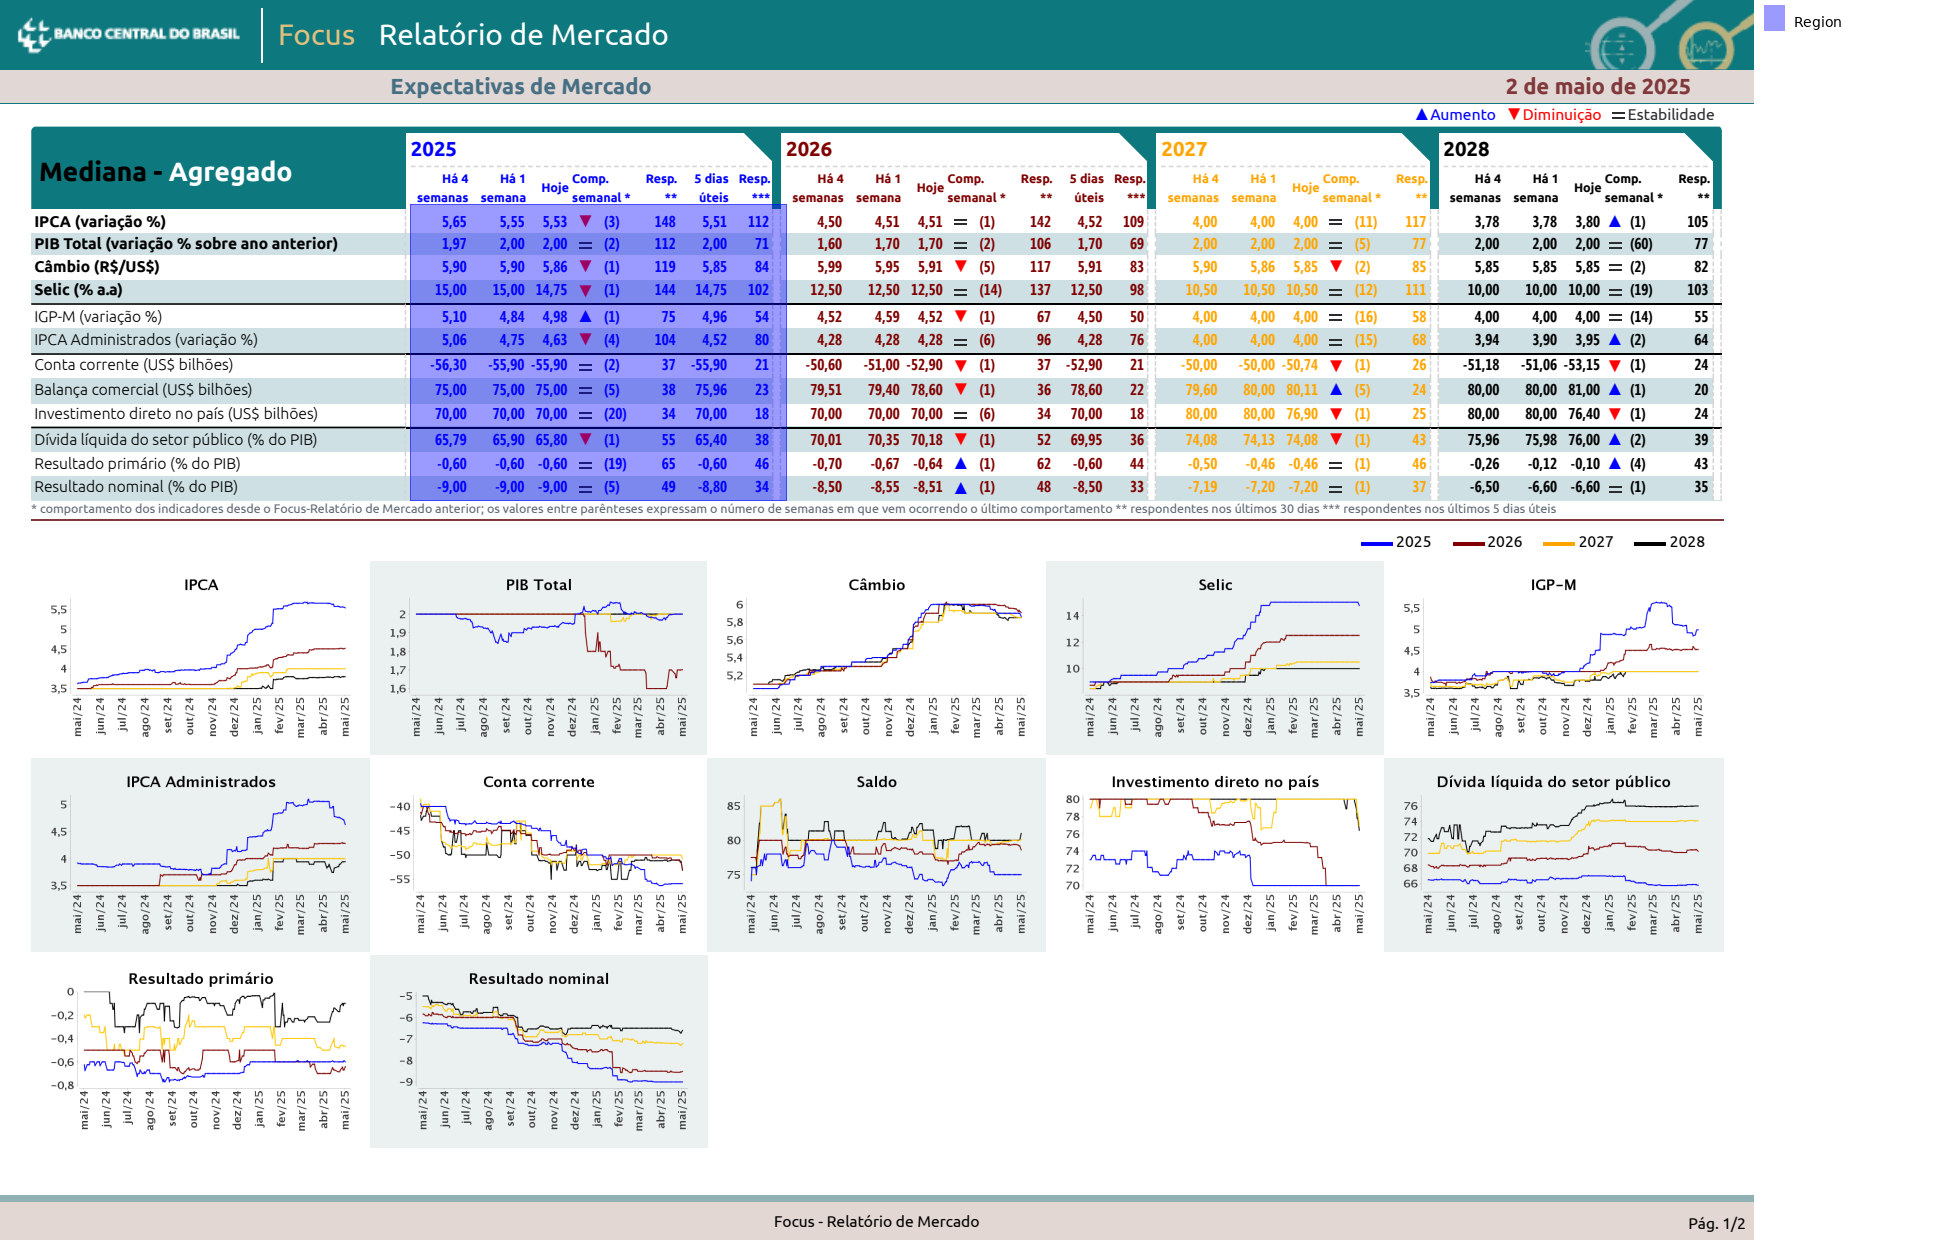
We start by grabbing the space between the 2025 and 2026 headers.
(
    data
    .find('text:contains(2025)')
    .right(
        until='text:contains(2026)',
        include_source=True,
        include_endpoint=False
    )
).show()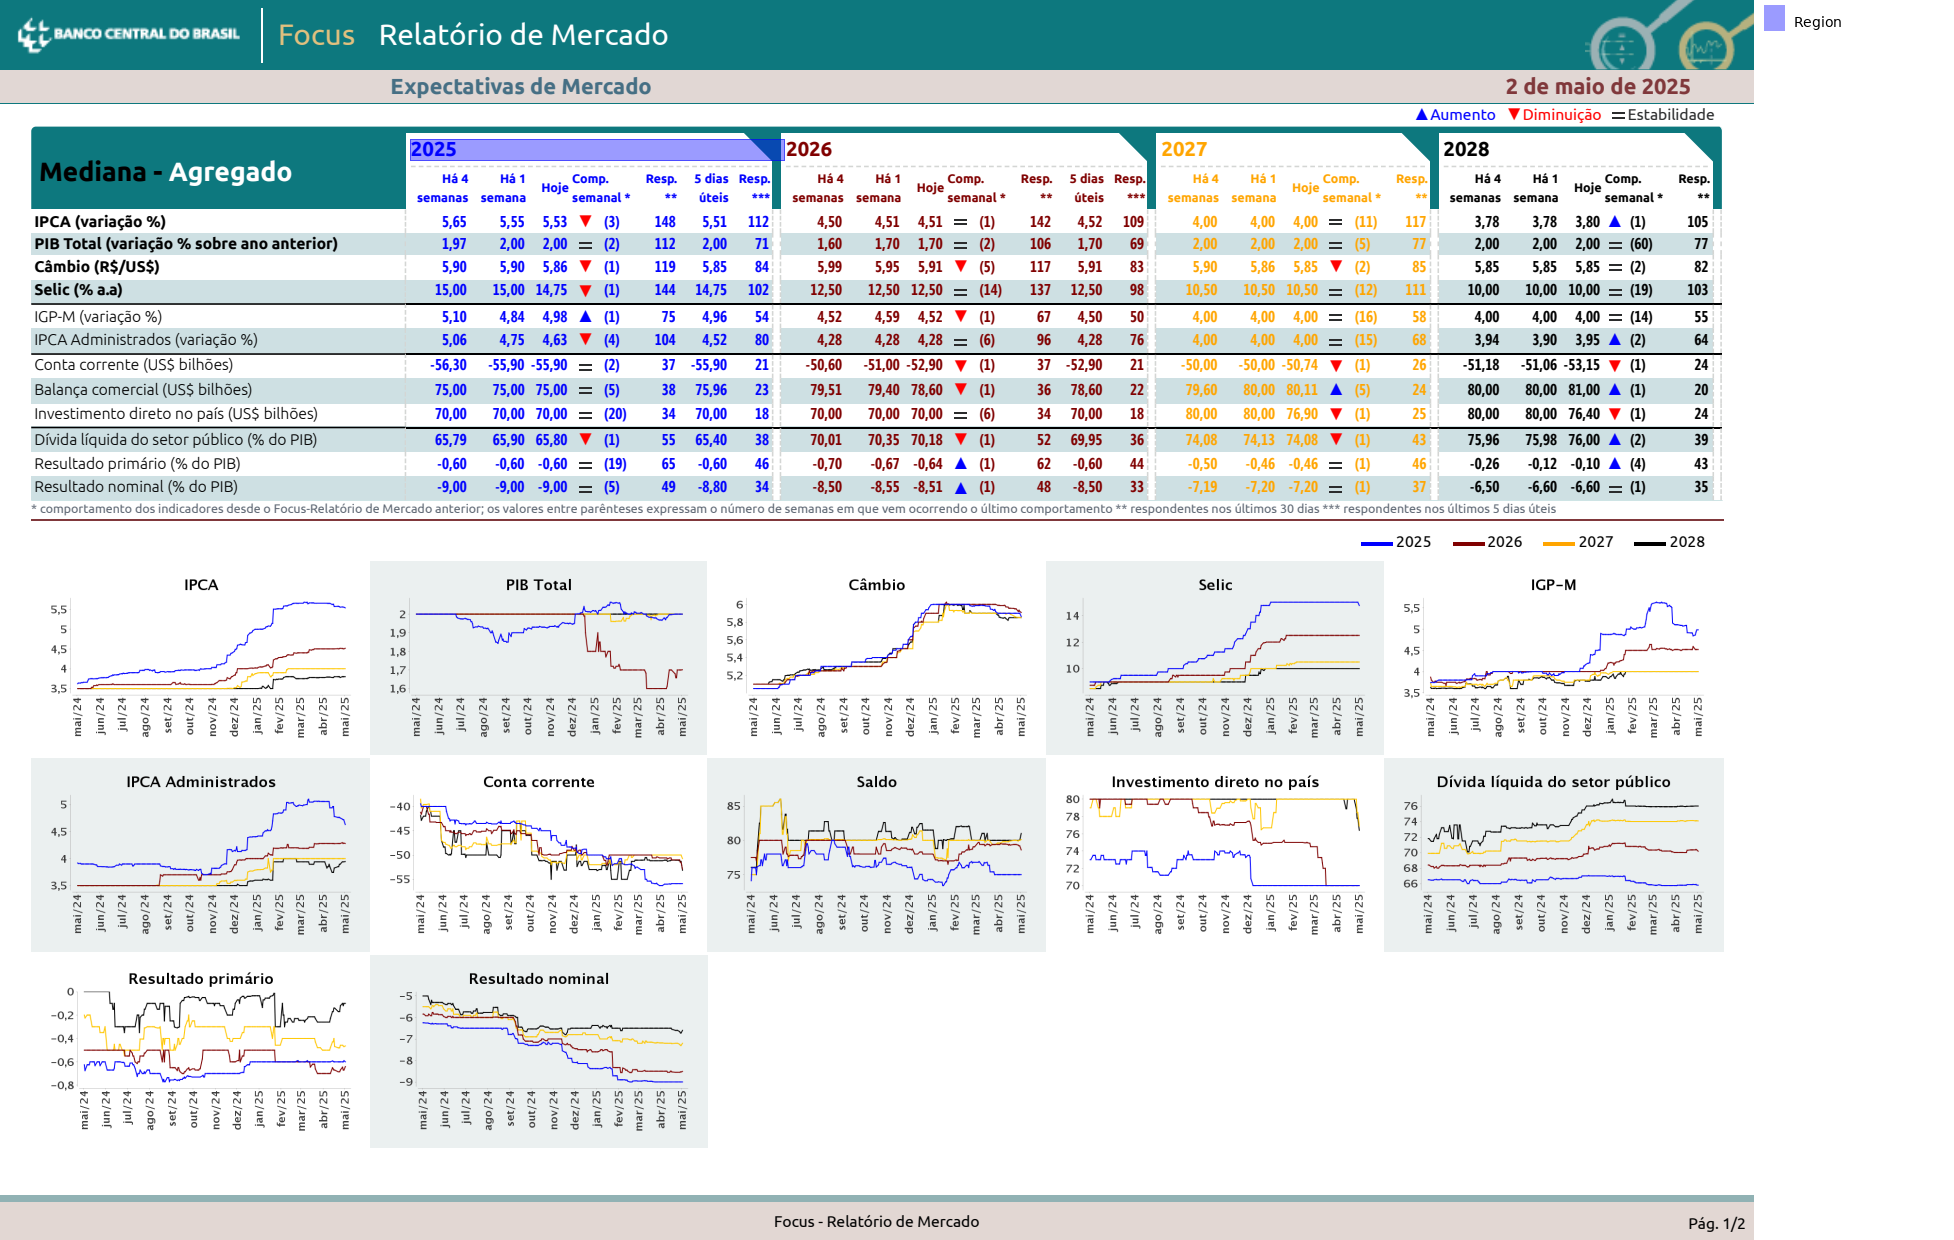
...then we move down...
(
    data
    .find('text:contains(2025)')
    .right(
        until='text:contains(2026)',
        include_source=True,
        include_endpoint=False
    )
    .below(width='element')
).show()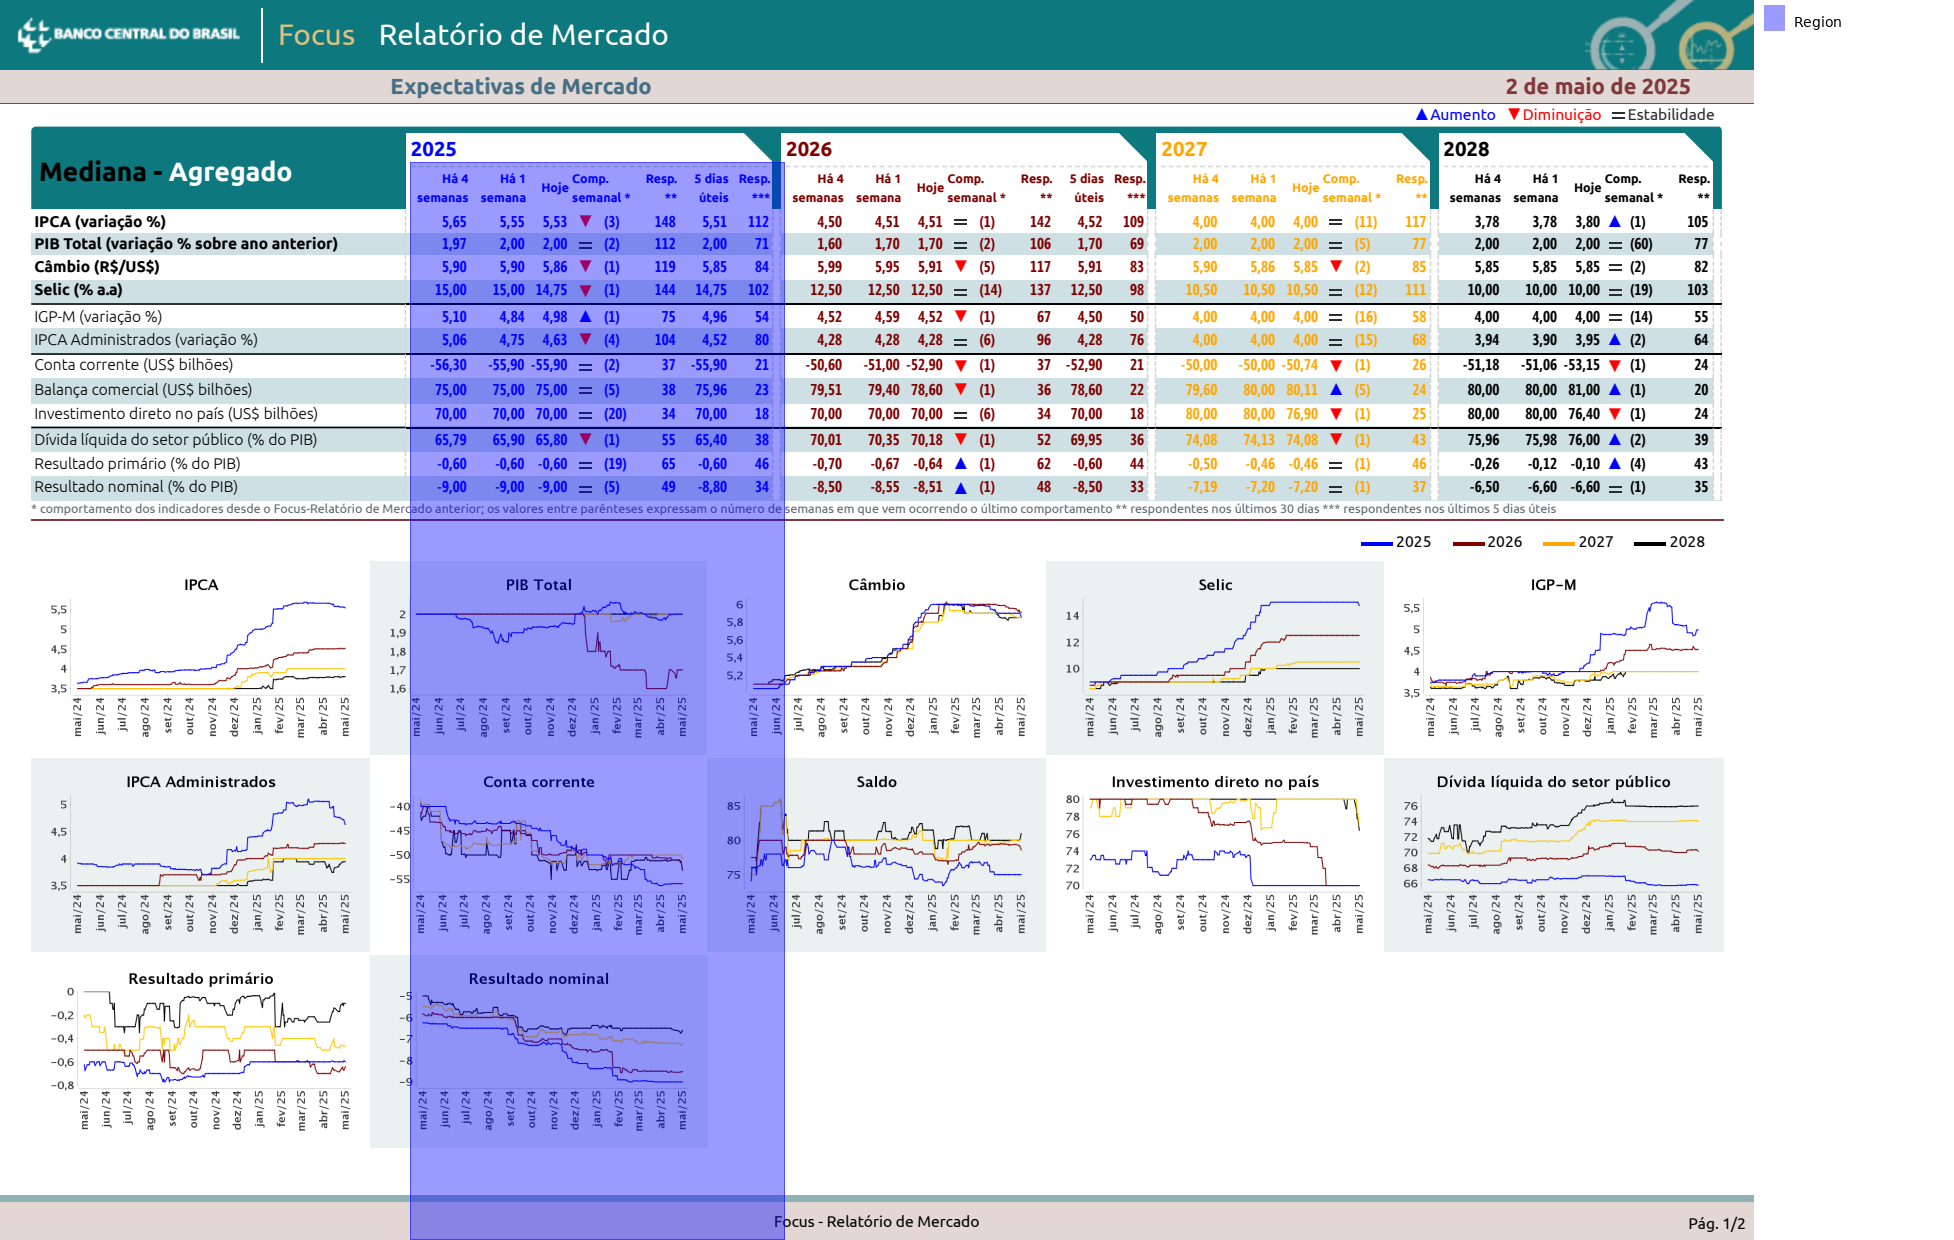
...then we nudge the top down a little bit and clip it to the size of the region of interest (the data region).
table = (
    data
    .find('text:contains(2025)')
    .right(
        until='text:contains(2026)',
        include_source=True,
        include_endpoint=False
    )
    .below(width='element')
    .expand(top=-20)
    .clip(data)
)

table.show()
We could try to figure out something magic with all of the headers and colors and backgrounds and blah blah blah, but it's easier to just extract the table using the "stream" method, which looks at the gaps between rows and columns. While there are actual boundaries between the rows, I promise stream works the best.
df_2025 = table.expand(top=-5).extract_table('stream').to_df(header=False)
df_2025| 0 | 1 | 2 | 3 | 4 | 5 | 6 | 7 | |
|---|---|---|---|---|---|---|---|---|
| 0 | 5,65 | 5,55 | 5,53 | ▼ | (3) | 148 | 5,51 | 112 |
| 1 | 1,97 | 2,00 | 2,00 | <NA> | (2) | 112 | 2,00 | 71 |
| 2 | 5,90 | 5,90 | 5,86 | ▼ | (1) | 119 | 5,85 | 84 |
| 3 | 15,00 | 15,00 | 14,75 | ▼ | (1) | 144 | 14,75 | 102 |
| 4 | 5,10 | 4,84 | 4,98 | ▲ | (1) | 75 | 4,96 | 54 |
| 5 | 5,06 | 4,75 | 4,63 | ▼ | (4) | 104 | 4,52 | 80 |
| 6 | <NA> | <NA> | <NA> | <NA> | <NA> | <NA> | <NA> | <NA> |
| 7 | -56,30 | -55,90 | -55,90 | <NA> | (2) | 37 | -55,90 | 21 |
| 8 | <NA> | <NA> | <NA> | <NA> | <NA> | <NA> | <NA> | <NA> |
| 9 | 75,00 | 75,00 | 75,00 | <NA> | (5) | 38 | 75,96 | 23 |
| 10 | 70,00 | 70,00 | 70,00 | <NA> | (20) | 34 | 70,00 | 18 |
| 11 | <NA> | <NA> | <NA> | <NA> | <NA> | <NA> | <NA> | <NA> |
| 12 | 65,79 | 65,90 | 65,80 | ▼ | (1) | 55 | 65,40 | 38 |
| 13 | -0,60 | -0,60 | -0,60 | <NA> | (19) | 65 | -0,60 | 46 |
| 14 | -9,00 | -9,00 | -9,00 | <NA> | (5) | 49 | -8,80 | 34 |
It needs a little cleanup. Due to using the steam approach we got some extra (empty) columns, but we can just drop them with pandas. We'll also insert the year and the row titles that we grabbed up above.
df_2025 = df_2025.dropna(axis=0, how='all')
df_2025.insert(0, 'year', 2025)
df_2025.insert(0, 'value', headers)
df_2025| value | year | 0 | 1 | 2 | 3 | 4 | 5 | 6 | 7 | |
|---|---|---|---|---|---|---|---|---|---|---|
| 0 | IPCA (variação %) | 2025 | 5,65 | 5,55 | 5,53 | ▼ | (3) | 148 | 5,51 | 112 |
| 1 | PIB Total (variação % sobre ano anterior) | 2025 | 1,97 | 2,00 | 2,00 | <NA> | (2) | 112 | 2,00 | 71 |
| 2 | Câmbio (R$/US$) | 2025 | 5,90 | 5,90 | 5,86 | ▼ | (1) | 119 | 5,85 | 84 |
| 3 | Selic (% a.a) | 2025 | 15,00 | 15,00 | 14,75 | ▼ | (1) | 144 | 14,75 | 102 |
| 4 | IGP-M (variação %) | 2025 | 5,10 | 4,84 | 4,98 | ▲ | (1) | 75 | 4,96 | 54 |
| 5 | IPCA Administrados (variação %) | 2025 | 5,06 | 4,75 | 4,63 | ▼ | (4) | 104 | 4,52 | 80 |
| 7 | Conta corrente (US$ bilhões) | 2025 | -56,30 | -55,90 | -55,90 | <NA> | (2) | 37 | -55,90 | 21 |
| 9 | Balança comercial (US$ bilhões) | 2025 | 75,00 | 75,00 | 75,00 | <NA> | (5) | 38 | 75,96 | 23 |
| 10 | Investimento direto no país (US$ bilhões) | 2025 | 70,00 | 70,00 | 70,00 | <NA> | (20) | 34 | 70,00 | 18 |
| 12 | Dívida líquida do setor público (% do PIB) | 2025 | 65,79 | 65,90 | 65,80 | ▼ | (1) | 55 | 65,40 | 38 |
| 13 | Resultado primário (% do PIB) | 2025 | -0,60 | -0,60 | -0,60 | <NA> | (19) | 65 | -0,60 | 46 |
| 14 | Resultado nominal (% do PIB) | 2025 | -9,00 | -9,00 | -9,00 | <NA> | (5) | 49 | -8,80 | 34 |
Working on all the other tables
2026 is basically the same.
table = (
    data
    .find('text:contains(2026)')
    .right(
        until='text:contains(2027)',
        include_source=True,
        include_endpoint=False
    )
    .below(width='element')
    .expand(top=-20)
    .clip(data)
)
table.show()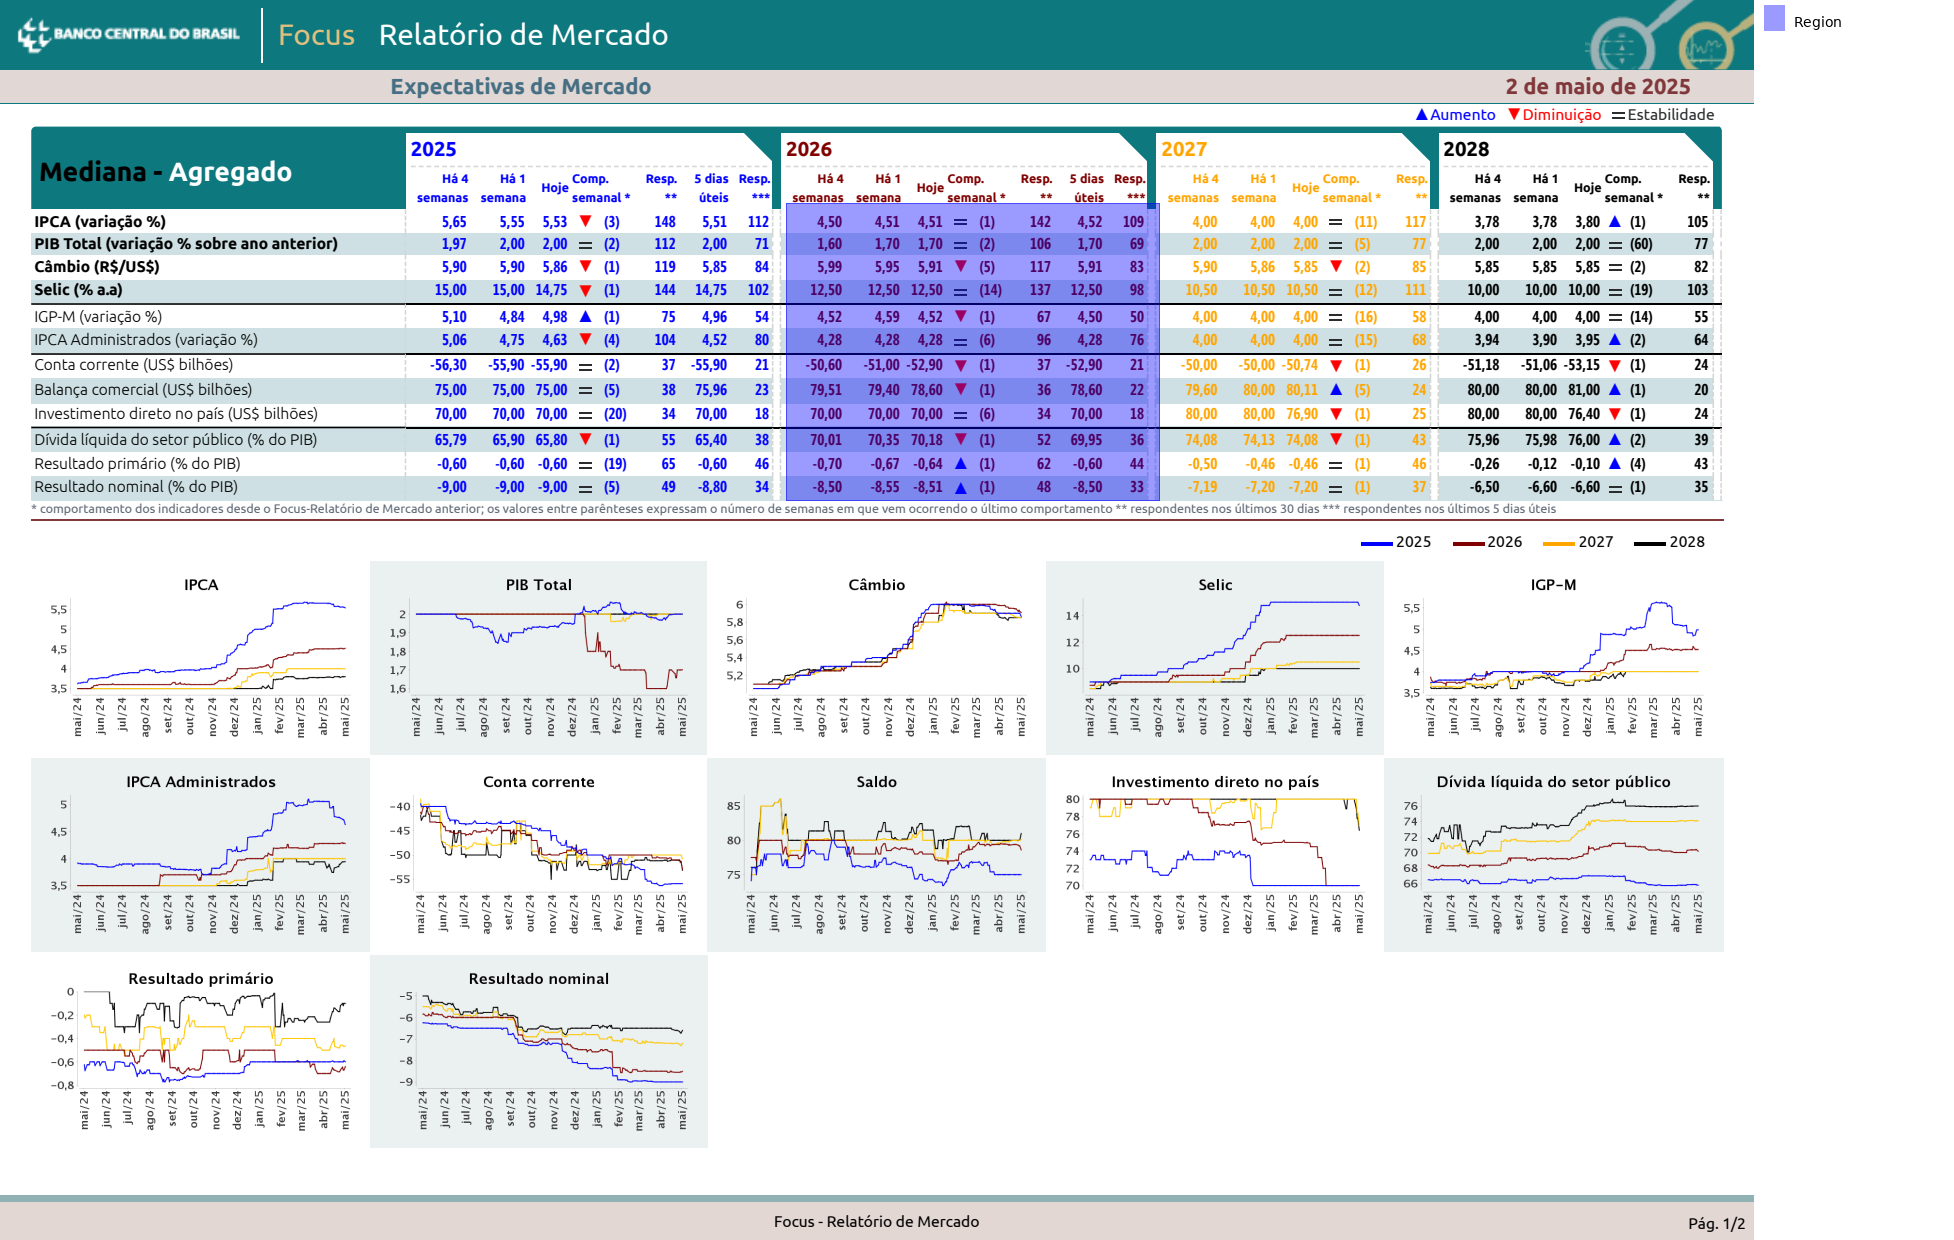
df_2026 = table.expand(top=-5).extract_table('stream').to_df(header=False).dropna(axis=0, how='all')
df_2026.insert(0, 'year', 2026)
df_2026.insert(0, 'value', headers)
df_2026| value | year | 0 | 1 | 2 | 3 | 4 | 5 | 6 | 7 | |
|---|---|---|---|---|---|---|---|---|---|---|
| 0 | IPCA (variação %) | 2026 | 4,50 | 4,51 | 4,51 | <NA> | (1) | 142 | 4,52 | 109 |
| 1 | PIB Total (variação % sobre ano anterior) | 2026 | 1,60 | 1,70 | 1,70 | <NA> | (2) | 106 | 1,70 | 69 |
| 2 | Câmbio (R$/US$) | 2026 | 5,99 | 5,95 | 5,91 | ▼ | (5) | 117 | 5,91 | 83 |
| 3 | Selic (% a.a) | 2026 | 12,50 | 12,50 | 12,50 | <NA> | (14) | 137 | 12,50 | 98 |
| 5 | IGP-M (variação %) | 2026 | 4,52 | 4,59 | 4,52 | ▼ | (1) | 67 | 4,50 | 50 |
| 6 | IPCA Administrados (variação %) | 2026 | 4,28 | 4,28 | 4,28 | <NA> | (6) | 96 | 4,28 | 76 |
| 8 | Conta corrente (US$ bilhões) | 2026 | -50,60 | -51,00 | -52,90 | ▼ | (1) | 37 | -52,90 | 21 |
| 9 | Balança comercial (US$ bilhões) | 2026 | 79,51 | 79,40 | 78,60 | ▼ | (1) | 36 | 78,60 | 22 |
| 10 | Investimento direto no país (US$ bilhões) | 2026 | 70,00 | 70,00 | 70,00 | <NA> | (6) | 34 | 70,00 | 18 |
| 12 | Dívida líquida do setor público (% do PIB) | 2026 | 70,01 | 70,35 | 70,18 | ▼ | (1) | 52 | 69,95 | 36 |
| 13 | Resultado primário (% do PIB) | 2026 | -0,70 | -0,67 | -0,64 | ▲ | (1) | 62 | -0,60 | 44 |
| 14 | Resultado nominal (% do PIB) | 2026 | -8,50 | -8,55 | -8,51 | ▲ | (1) | 48 | -8,50 | 33 |
As is 2027.
table = (
    data
    .find('text:contains(2027)')
    .right(
        until='text:contains(2028)',
        include_source=True,
        include_endpoint=False
    )
    .below(width='element')
    .expand(top=-20)
    .clip(data)
)
df_2027 = table.expand(top=-5).extract_table('stream').to_df(header=False).dropna(axis=0, how='all')
df_2027.insert(0, 'year', 2027)
df_2027.insert(0, 'value', headers)
df_2027| value | year | 0 | 1 | 2 | 3 | 4 | 5 | |
|---|---|---|---|---|---|---|---|---|
| 0 | IPCA (variação %) | 2027 | 4,00 | 4,00 | 4,00 | <NA> | (11) | 117 |
| 1 | PIB Total (variação % sobre ano anterior) | 2027 | 2,00 | 2,00 | 2,00 | <NA> | (5) | 77 |
| 2 | Câmbio (R$/US$) | 2027 | 5,90 | 5,86 | 5,85 | ▼ | (2) | 85 |
| 3 | Selic (% a.a) | 2027 | 10,50 | 10,50 | 10,50 | <NA> | (12) | 111 |
| 5 | IGP-M (variação %) | 2027 | 4,00 | 4,00 | 4,00 | <NA> | (16) | 58 |
| 6 | IPCA Administrados (variação %) | 2027 | 4,00 | 4,00 | 4,00 | <NA> | (15) | 68 |
| 8 | Conta corrente (US$ bilhões) | 2027 | -50,00 | -50,00 | -50,74 | ▼ | (1) | 26 |
| 9 | Balança comercial (US$ bilhões) | 2027 | 79,60 | 80,00 | 80,11 | ▲ | (5) | 24 |
| 10 | Investimento direto no país (US$ bilhões) | 2027 | 80,00 | 80,00 | 76,90 | ▼ | (1) | 25 |
| 11 | Dívida líquida do setor público (% do PIB) | 2027 | 74,08 | 74,13 | 74,08 | ▼ | (1) | 43 |
| 12 | Resultado primário (% do PIB) | 2027 | -0,50 | -0,46 | -0,46 | <NA> | (1) | 46 |
| 13 | Resultado nominal (% do PIB) | 2027 | -7,19 | -7,20 | -7,20 | <NA> | (1) | 37 |
2028 is a little different because it doesn't including an endpoint on the right. We just blast on through until we hit the right-hand side of the page.
table = (
    data
    .find('text:contains(2028)')
    .right(include_source=True)
    .below(width='element')
    .expand(top=-20)
    .clip(data)
)
df_2028 = table.expand(top=-5).extract_table('stream').to_df(header=False).dropna(axis=0, how='all')
df_2028.insert(0, 'year', 2028)
df_2028.insert(0, 'value', headers)
df_2028| value | year | 0 | 1 | 2 | 3 | 4 | 5 | |
|---|---|---|---|---|---|---|---|---|
| 0 | IPCA (variação %) | 2028 | 3,78 | 3,78 | 3,80 | ▲ | (1) | 105 |
| 1 | PIB Total (variação % sobre ano anterior) | 2028 | 2,00 | 2,00 | 2,00 | <NA> | (60) | 77 |
| 2 | Câmbio (R$/US$) | 2028 | 5,85 | 5,85 | 5,85 | <NA> | (2) | 82 |
| 3 | Selic (% a.a) | 2028 | 10,00 | 10,00 | 10,00 | <NA> | (19) | 103 |
| 5 | IGP-M (variação %) | 2028 | 4,00 | 4,00 | 4,00 | <NA> | (14) | 55 |
| 6 | IPCA Administrados (variação %) | 2028 | 3,94 | 3,90 | 3,95 | ▲ | (2) | 64 |
| 8 | Conta corrente (US$ bilhões) | 2028 | -51,18 | -51,06 | -53,15 | ▼ | (1) | 24 |
| 9 | Balança comercial (US$ bilhões) | 2028 | 80,00 | 80,00 | 81,00 | ▲ | (1) | 20 |
| 10 | Investimento direto no país (US$ bilhões) | 2028 | 80,00 | 80,00 | 76,40 | ▼ | (1) | 24 |
| 11 | Dívida líquida do setor público (% do PIB) | 2028 | 75,96 | 75,98 | 76,00 | ▲ | (2) | 39 |
| 12 | Resultado primário (% do PIB) | 2028 | -0,26 | -0,12 | -0,10 | ▲ | (4) | 43 |
| 13 | Resultado nominal (% do PIB) | 2028 | -6,50 | -6,60 | -6,60 | <NA> | (1) | 35 |
Now we'll set up the dataframes in a nice long list to combine in the next step.
dataframes = [df_2025, df_2026, df_2027, df_2028]Combining our data
Now that we have a list of dataframes (no matter which path we took) we can just use pandas to concatenate them.
import pandas as pd

df = pd.concat(dataframes, ignore_index=True)
df| value | year | 0 | 1 | 2 | 3 | 4 | 5 | 6 | 7 | |
|---|---|---|---|---|---|---|---|---|---|---|
| 0 | IPCA (variação %) | 2025 | 5,65 | 5,55 | 5,53 | ▼ | (3) | 148 | 5,51 | 112 |
| 1 | PIB Total (variação % sobre ano anterior) | 2025 | 1,97 | 2,00 | 2,00 | <NA> | (2) | 112 | 2,00 | 71 |
| 2 | Câmbio (R$/US$) | 2025 | 5,90 | 5,90 | 5,86 | ▼ | (1) | 119 | 5,85 | 84 |
| 3 | Selic (% a.a) | 2025 | 15,00 | 15,00 | 14,75 | ▼ | (1) | 144 | 14,75 | 102 |
| 4 | IGP-M (variação %) | 2025 | 5,10 | 4,84 | 4,98 | ▲ | (1) | 75 | 4,96 | 54 |
| 5 | IPCA Administrados (variação %) | 2025 | 5,06 | 4,75 | 4,63 | ▼ | (4) | 104 | 4,52 | 80 |
| 6 | Conta corrente (US$ bilhões) | 2025 | -56,30 | -55,90 | -55,90 | <NA> | (2) | 37 | -55,90 | 21 |
| 7 | Balança comercial (US$ bilhões) | 2025 | 75,00 | 75,00 | 75,00 | <NA> | (5) | 38 | 75,96 | 23 |
| 8 | Investimento direto no país (US$ bilhões) | 2025 | 70,00 | 70,00 | 70,00 | <NA> | (20) | 34 | 70,00 | 18 |
| 9 | Dívida líquida do setor público (% do PIB) | 2025 | 65,79 | 65,90 | 65,80 | ▼ | (1) | 55 | 65,40 | 38 |
| 10 | Resultado primário (% do PIB) | 2025 | -0,60 | -0,60 | -0,60 | <NA> | (19) | 65 | -0,60 | 46 |
| 11 | Resultado nominal (% do PIB) | 2025 | -9,00 | -9,00 | -9,00 | <NA> | (5) | 49 | -8,80 | 34 |
| 12 | IPCA (variação %) | 2026 | 4,50 | 4,51 | 4,51 | <NA> | (1) | 142 | 4,52 | 109 |
| 13 | PIB Total (variação % sobre ano anterior) | 2026 | 1,60 | 1,70 | 1,70 | <NA> | (2) | 106 | 1,70 | 69 |
| 14 | Câmbio (R$/US$) | 2026 | 5,99 | 5,95 | 5,91 | ▼ | (5) | 117 | 5,91 | 83 |
| 15 | Selic (% a.a) | 2026 | 12,50 | 12,50 | 12,50 | <NA> | (14) | 137 | 12,50 | 98 |
| 16 | IGP-M (variação %) | 2026 | 4,52 | 4,59 | 4,52 | ▼ | (1) | 67 | 4,50 | 50 |
| 17 | IPCA Administrados (variação %) | 2026 | 4,28 | 4,28 | 4,28 | <NA> | (6) | 96 | 4,28 | 76 |
| 18 | Conta corrente (US$ bilhões) | 2026 | -50,60 | -51,00 | -52,90 | ▼ | (1) | 37 | -52,90 | 21 |
| 19 | Balança comercial (US$ bilhões) | 2026 | 79,51 | 79,40 | 78,60 | ▼ | (1) | 36 | 78,60 | 22 |
| 20 | Investimento direto no país (US$ bilhões) | 2026 | 70,00 | 70,00 | 70,00 | <NA> | (6) | 34 | 70,00 | 18 |
| 21 | Dívida líquida do setor público (% do PIB) | 2026 | 70,01 | 70,35 | 70,18 | ▼ | (1) | 52 | 69,95 | 36 |
| 22 | Resultado primário (% do PIB) | 2026 | -0,70 | -0,67 | -0,64 | ▲ | (1) | 62 | -0,60 | 44 |
| 23 | Resultado nominal (% do PIB) | 2026 | -8,50 | -8,55 | -8,51 | ▲ | (1) | 48 | -8,50 | 33 |
| 24 | IPCA (variação %) | 2027 | 4,00 | 4,00 | 4,00 | <NA> | (11) | 117 | NaN | NaN |
| 25 | PIB Total (variação % sobre ano anterior) | 2027 | 2,00 | 2,00 | 2,00 | <NA> | (5) | 77 | NaN | NaN |
| 26 | Câmbio (R$/US$) | 2027 | 5,90 | 5,86 | 5,85 | ▼ | (2) | 85 | NaN | NaN |
| 27 | Selic (% a.a) | 2027 | 10,50 | 10,50 | 10,50 | <NA> | (12) | 111 | NaN | NaN |
| 28 | IGP-M (variação %) | 2027 | 4,00 | 4,00 | 4,00 | <NA> | (16) | 58 | NaN | NaN |
| 29 | IPCA Administrados (variação %) | 2027 | 4,00 | 4,00 | 4,00 | <NA> | (15) | 68 | NaN | NaN |
| 30 | Conta corrente (US$ bilhões) | 2027 | -50,00 | -50,00 | -50,74 | ▼ | (1) | 26 | NaN | NaN |
| 31 | Balança comercial (US$ bilhões) | 2027 | 79,60 | 80,00 | 80,11 | ▲ | (5) | 24 | NaN | NaN |
| 32 | Investimento direto no país (US$ bilhões) | 2027 | 80,00 | 80,00 | 76,90 | ▼ | (1) | 25 | NaN | NaN |
| 33 | Dívida líquida do setor público (% do PIB) | 2027 | 74,08 | 74,13 | 74,08 | ▼ | (1) | 43 | NaN | NaN |
| 34 | Resultado primário (% do PIB) | 2027 | -0,50 | -0,46 | -0,46 | <NA> | (1) | 46 | NaN | NaN |
| 35 | Resultado nominal (% do PIB) | 2027 | -7,19 | -7,20 | -7,20 | <NA> | (1) | 37 | NaN | NaN |
| 36 | IPCA (variação %) | 2028 | 3,78 | 3,78 | 3,80 | ▲ | (1) | 105 | NaN | NaN |
| 37 | PIB Total (variação % sobre ano anterior) | 2028 | 2,00 | 2,00 | 2,00 | <NA> | (60) | 77 | NaN | NaN |
| 38 | Câmbio (R$/US$) | 2028 | 5,85 | 5,85 | 5,85 | <NA> | (2) | 82 | NaN | NaN |
| 39 | Selic (% a.a) | 2028 | 10,00 | 10,00 | 10,00 | <NA> | (19) | 103 | NaN | NaN |
| 40 | IGP-M (variação %) | 2028 | 4,00 | 4,00 | 4,00 | <NA> | (14) | 55 | NaN | NaN |
| 41 | IPCA Administrados (variação %) | 2028 | 3,94 | 3,90 | 3,95 | ▲ | (2) | 64 | NaN | NaN |
| 42 | Conta corrente (US$ bilhões) | 2028 | -51,18 | -51,06 | -53,15 | ▼ | (1) | 24 | NaN | NaN |
| 43 | Balança comercial (US$ bilhões) | 2028 | 80,00 | 80,00 | 81,00 | ▲ | (1) | 20 | NaN | NaN |
| 44 | Investimento direto no país (US$ bilhões) | 2028 | 80,00 | 80,00 | 76,40 | ▼ | (1) | 24 | NaN | NaN |
| 45 | Dívida líquida do setor público (% do PIB) | 2028 | 75,96 | 75,98 | 76,00 | ▲ | (2) | 39 | NaN | NaN |
| 46 | Resultado primário (% do PIB) | 2028 | -0,26 | -0,12 | -0,10 | ▲ | (4) | 43 | NaN | NaN |
| 47 | Resultado nominal (% do PIB) | 2028 | -6,50 | -6,60 | -6,60 | <NA> | (1) | 35 | NaN | NaN |
There we go!